Cognor Group operates on the Polish market and exports its products abroad (mainly to other European countries, largely to Germany, where the Group sold approx. 18% of its sales volume in 2016).
The key buyers of the Group’s products are automotive and construction industry entities, mainly in Poland but also in Europe, largely in Germany, to which the Group sold an estimated 23% and 27% of its sales of semi-finished products and final products, respectively, in 2016.
Perspectives for the global steel market
According to forecasts, global steel production will increase to 1.87 Mg by 2020 (average annual growth of 1.92%).
Source: GLOBAL STEEL LONG PRODUCTS MARKET, 2016-2020, TECHNAVIO.COM

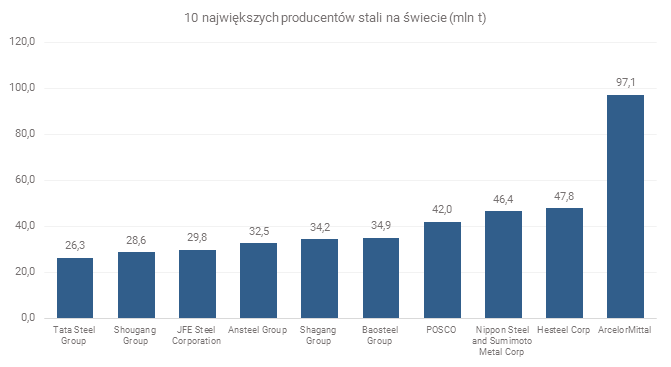
Source: World Steel Association 2015, report.
Economic situation in Poland
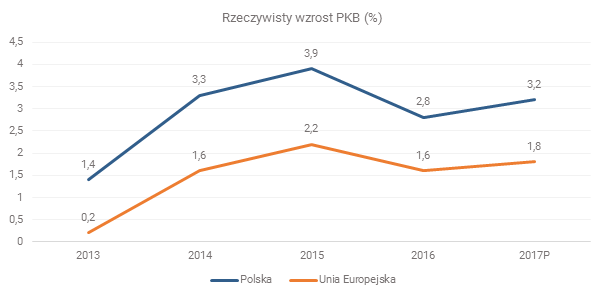
Given the fact that the Group mostly operates in Poland, the local macroeconomic situation has and will continue to have impact on the Group’s situation, financial results and development.
The following table presents changes in key macroeconomic indicators for Poland in 2009-2015.
| Rok zakończony 31 grudnia | ||||||||
| 2009 | 2010 | 2011 | 2012 | 2013 | 2014 | 2015 | 2016 | |
| (%) | ||||||||
| Stopa wzrostu realnego PKB* | 2,8 | 3,6 | 5,0 | 1,6 | 1,4 | 3,3 | 3,9 | |
| Stopa wzrostu sprzedaży detalicznej | 1,7 | (1,0) | 3,2 | 0,5 | 1,3 | 3,9 | 5,4 | |
| Stopa wzrostu popytu krajowego w Polsce | (0,2) | 4,2 | 4,2 | (0,5) | (0,6) | 4,7 | 3,4 | |
| Wskaźnik cen towarów i usług konsumpcyjnych | 3,5 | 2,6 | 4,3 | 3,7 | 0,9 | 0,0 | (0,9) | |
| Stopa wzrostu nakładów inwestycyjnych | (0,8) | 0,2 | 10,6 | (2,8) | (1,2) | 9,5 | 7,1 | |
| Stopa bezrobocia | 12,1 | 12,4 | 12,5 | 13,4 | 13,4 | 11,5 | 9,7 | |
| Stopa wzrostu eksportu | (8,0) | 13,2 | 8,1 | 3,4 | 6,5 | 6,7 | 7,7 | |
| Stopa wzrostu indywidualnej konsumpcji gospodarstw domowych | 3,5 | 2,6 | 3,3 | 0,8 | 0,3 | 2,6 | 3,2 | |
| Stopa wzrostu przeciętnego miesięcznego wynagrodzenia realne brutto w gospodarce narodowej ogółem | 2,0 | 1,4 | 1,4 | 0,1 | 2,8 | 3,2 | 3,5 | |
Source: GUS
 Steel production – situation on the global market
Global steel production and disclosed consumption of steelworks products
The following chart shows global steel production in 2015-2016.
Source: STEEL STATISTICAL YEARBOOK 2016, World Steel Association, Economics Committee


